
-1.png)
According to Redfin (Oct 14), U.S. home sellers outnumbered buyers by an estimated 62.6% in September 2026, according to Redfin’s October 14 report, a record high since 2013, up from 56.9% in August.
This buyer-skewed ratio theoretically offers more inventory, lower competition, and greater negotiation leverage. In practice, affordability remains a major barrier for buyers, while sellers resist steep price cuts despite softening demand.
Q3 and October market metrics illustrate this deadlock, confirming that record excess inventory does not signal an impending housing crash.
What the 63% Seller–Buyer Gap Actually Measures
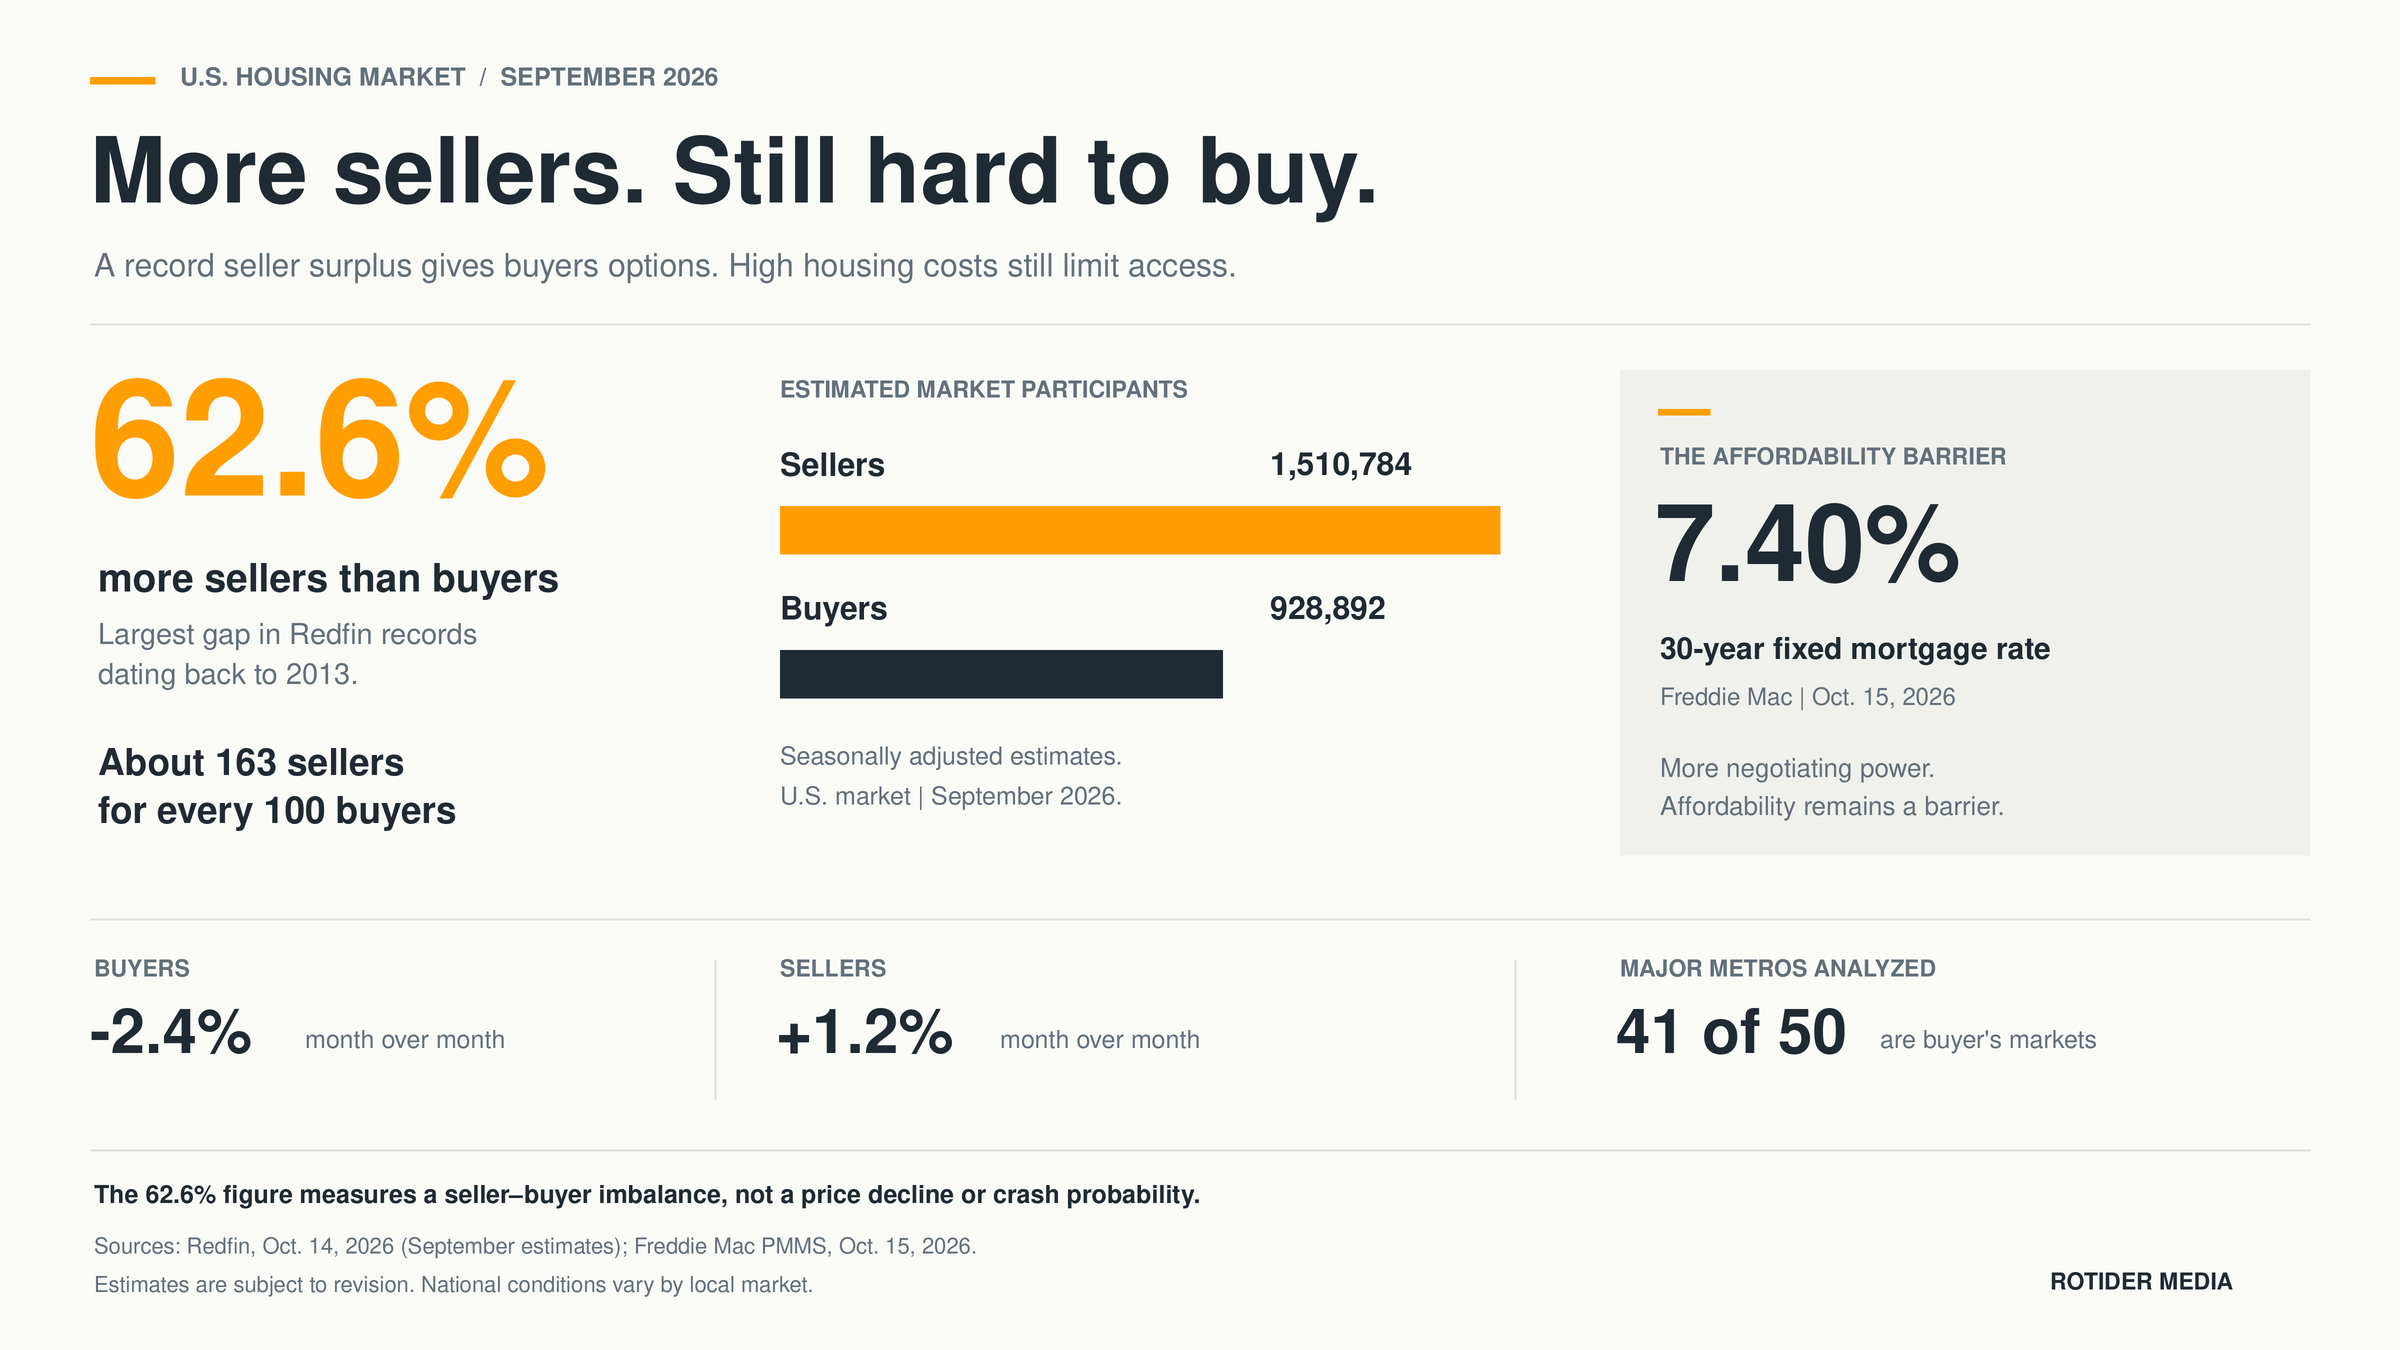
Redfin estimates seller volume via MLS listings and models buyer activity through MLS usage and proprietary search data. All figures are seasonally adjusted.
The imbalance equates to roughly 163 sellers per 100 buyers. This does not mean active sellers grew by 63% in September, nor does it imply a proportional price drop.
Redfin estimates buyer volume fell 2.4% month-over-month, while seller volume rose 1.2%. The widening gap reflects both buyer retreat and new seller entry.
This percentage split alone does not measure seller urgency or acceptable price floors.
Q3 Data Shows Inventory Accumulating as Demand Weakens
Realtor.com’s monthly reports provide context across the third quarter:
|
Metric |
July 2026 |
August 2026 |
September 2026 |
|
Active listings |
1,126,252 |
1,140,035 |
1,161,615 |
|
Pending listings, year-over-year change |
+1.3% |
−0.2% |
−4.1% |
|
Share of listings with price reductions |
20.0% |
20.4% |
20.8% |
These are monthly observations within Q3, not quarterly totals or averages. Sources: Realtor.com reports published August 3, September 2, and September 30.
This combination indicates rising active inventory and softer pending sales. Note that pending sales track total homes under contract, not new monthly contract volume.
Higher inventory does not necessarily mean a surge in new sellers. Realtor.com reported that September new listings fell 0.7% year-over-year even as active inventory expanded.
The distinction lies between fresh market supply and lingering inventory. Properties accumulate simply when sales velocity slows, without requiring a spike in new listings.
Ultimately, the core challenge is matching buyers' financial capabilities with available homes at acceptable prices and terms. Listing counts only tell part of the story.
Why the Sun Belt Looks Different
Redfin classifies 41 out of 50 major metros as buyer's markets, led by inventory surpluses in Miami, Nashville, and Houston, while 5 metros remain seller-dominated.
The Sun Belt imbalance, notably in Texas and Florida, is driven by robust new construction combined with rising insurance costs and HOA fees. Conversely, markets with restricted homebuilding continue to face supply tightness.
Buyers evaluate total monthly ownership costs (taxes, insurance, HOA, maintenance) rather than sticker price alone. Consequently, negotiation leverage varies significantly by local market, price point, and property type rather than following a uniform national trend.
More Negotiating Power Does Not Restore Affordability
According to Freddie Mac (Oct 15), 30-year fixed mortgage rates averaged 7.40%, up sharply from 6.27% a year earlier.
NAR's September report placed the median existing-home price at $417,500 (up 1.3% YoY). Sales volume rose 1.5% month-over-month but dropped 2.2% year-over-year.
These metrics highlight a fundamental mismatch: reduced market competition has not translated into lower monthly payments. Cash-ready buyers gain negotiation power, whereas expanded inventory provides little immediate relief to priced-out households.
Furthermore, national median prices reflect the mix of homes sold rather than individual property valuations. A rising median price can easily coexist with localized or segment-specific price declines.
Buyer Leverage Can Appear in the Terms, Not Just the Price
Mortgage expert Jennifer Beeston's October 15 commentary highlights non-price negotiations, including seller concessions for closing costs, repair credits, and interest rate buydowns. These case examples illustrate specific client transactions rather than establishing a national benchmark rate for concessions.
The core takeaway is that a deal can become significantly more favorable for buyers without reducing the officially recorded sale price.
Different concessions address different constraints:
|
Negotiated adjustment |
Potential effect |
|
Lower purchase price |
Reduces the agreed acquisition price and may reduce the amount financed |
|
Seller contribution toward eligible closing costs |
Reduces the buyer’s cash needed at closing |
|
Agreed repairs or repair credits |
Addresses specific property-condition costs |
|
Temporary mortgage buydown |
Reduces scheduled payments during an introductory period |
Availability depends on negotiated terms and specific financial qualifications. These options are not guaranteed simply by a "buyer's market" classification.
A clear distinction must be made between temporary payment relief and long-term affordability. The CFPB notes that temporary buydowns typically last one to three years, after which monthly obligations rise. Fluctuating taxes and insurance can further adjust monthly payments.
Price data alone does not fully capture shifts in bargaining power. Likewise, a favorable initial transaction structure should not automatically be characterized as a long-term affordable purchase.
October Builder Data Adds Another Warning Signal
NAHB's October 19 update adds perspective beyond the existing-home market.
The NAHB/Wells Fargo Housing Market Index dropped to 29—its lowest level since June 2012. October survey results reveal that 43% of builders reduced prices, while 65% offered sales incentives.
These metrics reflect builder sentiment and direct developer practices, confirming that market pressure extends from resale homes into the new construction sector.
While builder price cuts and concessions expand options for buyers, sentiment indices and discount frequencies alone do not confirm nationwide trends for actual finalized sale prices.
Does a Record Gap Mean Another Housing Crash?
Historical comparisons require strict precision. While current supply imbalance metrics mark a high since 2013, they do not imply that mortgage credit quality, household solvency, foreclosure pressure, or systemic risk mirror the conditions of previous housing crashes.
The seller-to-buyer ratio does not distinguish between motivated negotiators and distressed sellers. Homeowners with substantial equity may simply withdraw listings or hold out rather than make steep price cuts.
Market adjustment can take multiple paths: price moderation, expanded seller concessions, buyer re-entry as financing conditions improve, or inventory contraction. Individual local markets will experience distinct combinations of these dynamics.
In summary, a record surplus of sellers proves supply-demand dislocation, but it does not serve as a prediction of an impending market crash.
Rotider’s Take: A Narrower Gap Would Not Necessarily Signal Recovery
The underlying drivers of the supply-demand gap are just as vital as the headline percentages. A narrowing gap can result either from buyers returning or sellers withdrawing listings, two paths signaling drastically different market realities:
-
Buyer Re-entry: If a narrowing gap coincides with a sustained rise in new contracts and completed sales across multiple reporting periods, it provides convincing proof of market recovery and improving affordability.
-
Seller Withdrawal: If the gap shrinks primarily because inventory is pulled, transaction volume remains depressed. Buyers end up with fewer options without gaining financial capability.
A genuine housing market recovery requires validation across three core pillars:
-
Participation: Growing numbers of active, qualified buyers.
-
Transactions: Sustainable expansion in contract signings and closed deals.
-
Affordability: Lasting easing of purchase constraints (beyond temporary concessions).
A more balanced market does not automatically denote a healthier one. While September data confirms reduced competition for buyers, a broad-based recovery hinges on actual demand growth, transaction liquidity, and long-term affordability.
Data reviewed through October 20, 2026. September and Q3 observations are distinguished from October updates. Providers use different methodologies and coverage; their inventory figures should not be treated as interchangeable.


 (1).png)